

Local Market Snapshot: April 2026 in the Longleaf Pine REALTORS® Region
What REALTORS® Are Seeing Across Our Communities Last Month
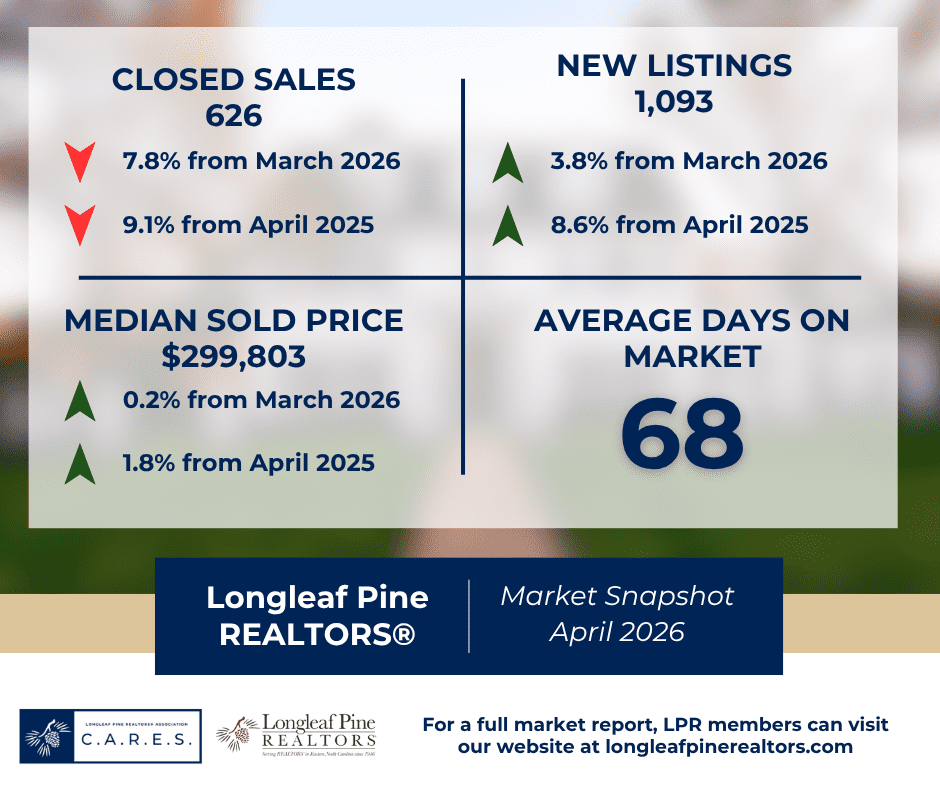
April housing data across the Longleaf Pine REALTORS® region points to a market with more inventory, continued price resilience, and more selective buyer activity by property type and price point. Across all residential properties, new listings increased 8.6 percent year over year to 1,093, and pending sales rose 9.4 percent to 783. Closed sales, however, declined 9.1 percent to 626, suggesting that while buyer interest remains active, not all activity is translating into closings at the same pace. Homes for sale increased 14.7 percent to 2,392, bringing the region to 3.8 months of inventory. Median sales price rose 1.8 percent to $299,803, while average sales price increased 4.2 percent to $311,744.
The broader 12-month view shows a market that remains steady overall, even as activity continues to shift toward higher price points and new construction. For the period spanning May 2025 through April 2026, pending sales were up 0.3 percent overall, with the strongest gain in the $350,000 and above price range, where pending sales increased 7.6 percent. New construction posted the strongest sales growth by construction status, up 6.9 percent, while townhouse/condo properties posted the strongest growth by property type, up 4.0 percent. The rolling median sales price increased 3.1 percent to $299,000, and townhouse/condo properties continued to show the largest 12-month price gain by property type, up 11.0 percent to $188,750..
Regional Overview
April’s numbers suggest a market that is active, but no longer moving at the same compressed pace buyers and sellers experienced in recent years. Days on market increased 11.5 percent year over year to 68 days across all residential properties, while percent of list price received remained nearly unchanged at 98.6 percent. That combination points to a market where well-positioned homes are still commanding strong offers, but buyers have slightly more time and leverage than they did when inventory was tighter.
Existing single-family homes remained the main driver of regional activity. Closed sales were essentially flat, down just 0.2 percent to 454, while pending sales increased 6.2 percent to 549 and new listings rose 1.7 percent to 771. Inventory in this segment increased 14.7 percent to 1,404 homes, and months of supply rose from 2.7 to 3.2. Median sales price increased 2.3 percent to $274,500, while average sales price rose 5.8 percent to $299,696. These figures suggest a resale market that remains steady, with more choices for buyers and continued pricing strength for sellers.
New construction continued to play a major role in the region’s housing supply. New listings jumped 40.3 percent to 282, and pending sales rose 26.2 percent to 207. Closed sales, however, declined 21.6 percent to 152, indicating a gap between current buyer activity and completed transactions. Inventory increased 16.2 percent to 823 homes, and months of supply rose to 5.2. The median new construction sales price increased 0.8 percent to $352,430, and the segment continued to receive 100.0 percent of list price on average. Days on market increased to 110, reinforcing that new construction remains an important but slower-moving part of the market.
Townhouse and condo activity showed a different pattern in April. Closed sales fell 50.0 percent to 20, pending sales declined 22.9 percent to 27, and new listings dropped 14.9 percent to 40. Inventory increased 7.8 percent to 165 homes, with 5.5 months of supply. Median sales price decreased 13.4 percent to $154,500, while average sales price fell 16.2 percent to $162,910. Because this is a smaller segment of the regional market, month-to-month changes can appear more pronounced; however, the data suggests softer current activity compared to the stronger rolling 12-month price gains seen in the townhouse/condo category.
County-by-County Snapshot
Cumberland County
Cumberland County remained the region’s busiest market in April, recording 5,734 showings, up 2.4 percent year over year but down 6.2 percent from March. Buyer interest measured 4.5 showings per listing, while managed listings totaled 1,380. The $150,000 to $249,999 range generated the most activity with 2,195 showings, while the $250,000 to $349,999 range posted 1,953 showings and the strongest buyer interest at 5.0 showings per listing. Activity in the $350,000 and above segment also improved year over year, with showings up 6.2 percent and buyer interest up 9.1 percent. Overall, Cumberland remains highly active, with demand strongest in the region’s core mid-market price ranges.
Hoke County
Hoke County posted 1,150 showings in April, up 12.4 percent year over year and 0.7 percent from March. Buyer interest rose to 4.1 showings per listing, while managed listings totaled 304. The $250,000 to $349,999 price range led the market with 696 showings, while the $150,000 to $249,999 range recorded the highest buyer interest at 7.5 showings per listing. Hoke’s April data points to a market with strong engagement in attainable and mid-range price bands, even as managed listings were down 20.4 percent from a year ago.
Lee County
Lee County recorded 470 showings in April, up 39.9 percent year over year and 11.9 percent from March. Buyer interest measured 3.7 showings per listing, while managed listings increased to 147, up 41.3 percent from a year ago. The $350,000 and above segment generated the most activity with 191 showings, followed by the $250,000 to $349,999 segment with 160 showings. The $150,000 to $249,999 range posted the strongest buyer interest at 8.4 showings per listing. Lee County’s April numbers suggest a market gaining momentum, with both higher-end activity and strong competition in more attainable price bands.
Robeson County
Robeson County showed notable momentum in April, recording 497 total showings, up 41.2 percent year over year and 22.1 percent from March. Buyer interest rose to 2.8 showings per listing, while managed listings totaled 206. The $150,000 to $249,999 segment generated the most activity with 187 showings, followed by the $250,000 to $349,999 range with 128 showings. The $149,999 and below category and the $350,000 and above category both posted buyer interest of 3.1 showings per listing. Robeson’s April data points to broadening buyer activity across multiple price ranges, with especially strong year-over-year growth in overall showings and buyer engagement.
Looking Ahead
April’s housing data shows a region that is still moving, but with a more balanced balance between buyers and sellers than in recent years. Inventory is up, new listings are increasing, and pending sales remain positive, all of which suggest continued market activity heading into the late spring and early summer season. At the same time, closed sales were down, days on market increased, and activity varied significantly by property type, construction status, county, and price range.
For buyers and sellers alike, this remains a market where local expertise matters. Conditions continue to vary by county, by price point, and by property type, making hyper-local guidance more important than ever. For the most accurate neighborhood-level insight, Longleaf Pine REALTORS® members have the real-time market knowledge and professional expertise to help clients navigate today’s housing market with confidence.
You can find all the reports that produced this article here: