

Local Market Snapshot: July 2026 in the Longleaf Pine REALTORS® Region
What REALTORS® Are Seeing Across Our Communities Last Month
July housing data across the Longleaf Pine REALTORS® region reflects a market with more available inventory, continued contract activity, and modest price growth—alongside longer marketing timelines and varied performance across property types.
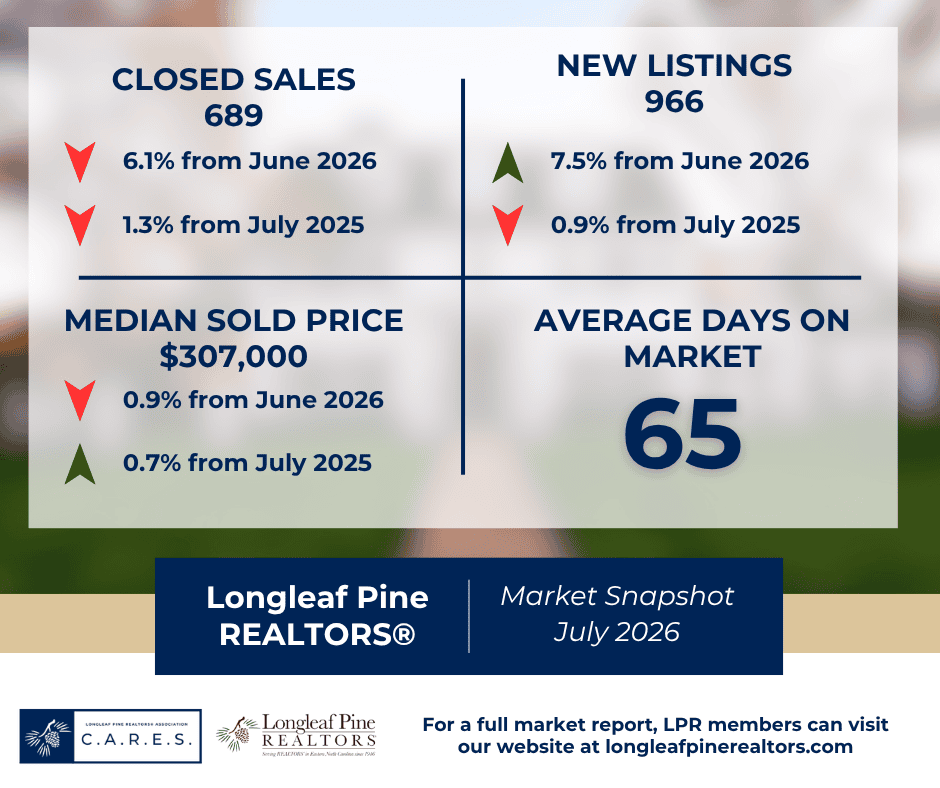
Across all residential properties, new listings declined 0.9 percent year over year to 966. Pending sales increased 4.3 percent to 676, while closed sales declined 1.3 percent to 689. Homes for sale increased 13.1 percent to 2,676, bringing the region to 4.3 months of inventory. The median sales price increased 0.7 percent to $307,000, while the average sales price declined slightly—down 0.3 percent to $315,369.
The year-to-date picture remains generally stable. Through July, new listings were up 0.7 percent, pending sales increased 1.6 percent, and closed sales rose 0.9 percent compared with the same period last year. The year-to-date median sales price was essentially unchanged at $299,999, while the average sales price increased 1.0 percent to $310,940.
The broader rolling 12-month view shows continued strength at higher price points. From August 2025 through July 2026, pending sales increased 0.9 percent overall. The $350,000-and-above range posted the strongest gain, rising 5.9 percent, while new-construction pending sales increased 2.4 percent. The rolling median sales price rose 1.4 percent to $299,000, with townhouse and condominium properties recording the strongest price growth—up 21.8 percent to $207,000.
Regional Overview
July’s numbers point to a market that remains active while continuing its shift toward more balanced conditions. Buyers have considerably more inventory than they did a year ago, but properties are also taking longer to move from listing to accepted offer. Days on market across all residential properties increased 25.0 percent to 65 days, while sellers received an average of 98.7 percent of their most recent list price.
The rolling 12-month data reinforces this slower pace. Average days on market increased 16.7 percent to 63 days, with the $350,000-and-above range taking the longest to sell at 75 days. The $150,000-to-$249,999 range moved the fastest at 45 days, although that was still 36.4 percent longer than a year ago.
This combination underscores the importance of accurate pricing, thoughtful preparation, and a strong marketing strategy. Buyers remain engaged, but increased inventory gives them more time and more options to compare before making a decision.
Existing Single-Family Homes
Existing single-family homes remained the largest source of regional activity. New listings increased 0.7 percent to 710, while pending sales rose 6.0 percent to 514. Closed sales declined slightly—down 0.8 percent to 491.
Inventory increased 14.0 percent to 1,673 homes, while months of supply rose from 3.4 to 3.8. The median sales price increased 2.7 percent to $295,000, and the average sales price rose 0.7 percent to $307,646.
Days on market increased from 38 to 46 days, a 21.1 percent increase. Existing homes received an average of 98.4 percent of their most recent list price. The segment remains active, but buyers have more choices and homes are taking longer to secure accepted offers.
New Construction
New construction continued to provide a significant share of the region’s available inventory, although July sales activity softened. New listings declined 2.4 percent to 204, pending sales fell 3.1 percent to 127, and closed sales decreased 4.9 percent to 156.
Inventory rose 14.7 percent to 843 homes, producing 5.4 months of supply. The median new-construction sales price declined 0.7 percent to $351,047, while the average sales price decreased 2.1 percent to $369,064.
New-construction homes received an average of 99.9 percent of their most recent list price and spent 118 days on the market, up from 94 days a year earlier. The segment continues to offer buyers additional choices, particularly for those comparing builder incentives, financing options, move-in timelines, and available resale inventory.
Townhouses and Condominiums
Townhouse and condominium activity produced mixed results in July. New listings declined 14.8 percent to 52, while pending sales increased 9.4 percent to 35. Closed sales rose 7.7 percent to 42.
Inventory declined slightly—down 1.8 percent to 160 properties—while months of supply decreased from 5.6 to 5.3. The monthly median sales price increased 18.4 percent to $219,000, and the average sales price rose 3.3 percent to $206,212.
Days on market increased from 60 to 77 days, while sellers received an average of 97.7 percent of their most recent list price. Because this is a smaller segment with fewer monthly transactions, individual sales can have a greater effect on percentage changes. However, the rolling 12-month median price of $207,000—up 21.8 percent—provides additional evidence of longer-term price growth in this property type.
County-by-County Snapshot
Cumberland County
Cumberland County recorded 5,075 showings in July, down 5.0 percent year over year and 1.7 percent from June. Buyer interest measured 3.6 showings per listing, essentially unchanged from a year ago, while managed listings declined 5.1 percent to 1,489.
The $150,000-to-$249,999 range generated the most activity with 1,915 showings. The $250,000-to-$349,999 range followed with 1,664 showings and recorded the strongest buyer interest among the county’s major price ranges at 4.0 showings per listing. Homes priced at $350,000 and above generated 970 showings. Cumberland’s data reflects broad demand, although overall showing activity was slightly below both last year and the previous month.
Hoke County
Hoke County recorded 1,088 showings in July, up 34.0 percent year over year and 27.7 percent from June. Buyer interest increased 51.7 percent from a year ago to 4.0 showings per listing, while managed listings declined 11.7 percent to 310.
The $250,000-to-$349,999 range led the county with 634 showings, followed by the $150,000-to-$249,999 range with 234. Homes priced at $350,000 and above recorded 200 showings. Buyer interest was especially strong in the more attainable ranges. Properties priced from $150,000 to $249,999 averaged 6.0 showings per listing, while the limited number of listings below $150,000 averaged 7.5. Hoke County posted the strongest monthly growth in showing activity among the four counties highlighted in this report.
Lee County
Lee County recorded 362 showings in July, an increase of 16.8 percent year over year but a decline of 12.3 percent from June. Buyer interest measured 3.0 showings per listing, down 15.1 percent from last year, while managed listings increased 37.6 percent to 139.
The $350,000-and-above range generated the most activity with 163 showings, followed by the $250,000-to-$349,999 range with 124. More affordable homes continued to attract strong engagement when available: properties priced from $150,000 to $249,999 averaged 5.5 showings per listing. Lee County’s July numbers show that inventory growth is giving buyers more choices, even as overall showing activity remains above last year’s level.
Robeson County
Robeson County continued to demonstrate year-over-year momentum, recording 408 showings in July. That represented a 14.3 percent increase from last year and a 10.3 percent increase from June. Buyer interest rose 39.6 percent to 2.3 showings per listing, while managed listings declined 18.1 percent to 203.
The $150,000-to-$249,999 range generated the most activity with 166 showings, followed by the $250,000-to-$349,999 range with 105. Homes priced at $350,000 and above recorded 74 showings—an increase of 138.7 percent from a year ago—and generated the county’s strongest buyer interest at 3.6 showings per listing. Robeson’s data points to growing engagement across multiple price ranges, with particularly notable growth at the higher end of the market.
Looking Ahead
July’s housing data shows a region with expanding inventory, positive pending-sales activity, and generally resilient prices, even as monthly closings edged below last year’s level. Buyers have more options, but desirable and well-positioned properties are still attracting meaningful attention. Sellers should be prepared for longer marketing timelines and increased competition from both existing homes and new construction.
The market is not moving uniformly. Pending activity remains strongest in certain attainable and higher-priced segments, while inventory growth is particularly pronounced among single-family homes and properties priced at $350,000 and above. County-level showing activity also varies considerably, from strong monthly gains in Hoke and Robeson counties to a more measured pace in Cumberland and Lee counties.
For buyers and sellers alike, this remains a market where local expertise matters. Conditions continue to vary by county, by price point, and by property type, making hyper-local guidance more important than ever. For the most accurate neighborhood-level insight, Longleaf Pine REALTORS® members have the real-time market knowledge and professional expertise to help clients navigate today’s housing market with confidence.
You can find all the reports that produced this article here: