

Local Market Snapshot: September 2026 in the Longleaf Pine REALTORS® Region
What the Latest Housing Data Shows Across Our Communities
September housing data across the Longleaf Pine REALTORS® region reflects a market with more available inventory, continued price growth, and a slower pace of sales activity. While fewer homes went under contract or closed compared with a year ago, both median and average sales prices increased. Together, these trends point to a market where buyers have more choices and additional time to evaluate properties, while sellers continue to see opportunities when homes are priced and positioned competitively.
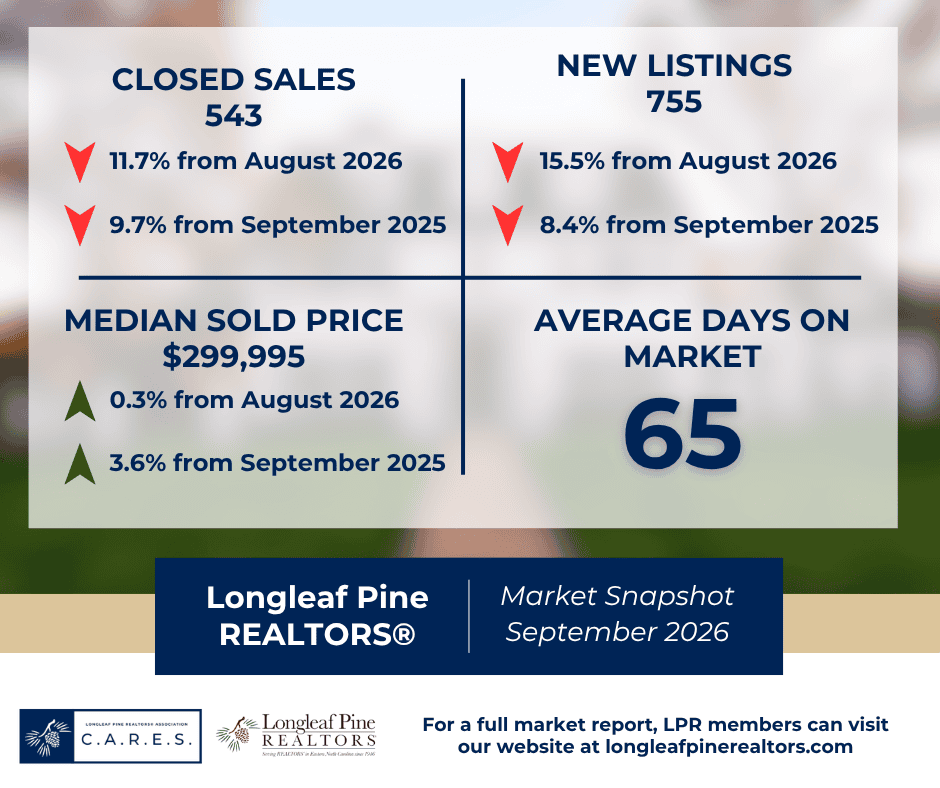
Across all residential properties, new listings declined 8.4 percent year over year to 755, while pending sales decreased 4.9 percent to 541. Closed sales fell 9.7 percent to 543, reflecting a slower pace of completed transactions. Meanwhile, homes for sale increased 11.6 percent to 2,681, bringing the region to 4.3 months of inventory, compared with 3.8 months a year earlier.
Despite fewer transactions, home prices continued to rise. The median sales price increased 3.6 percent to $299,995, while the average sales price climbed 6.4 percent to $315,043. These gains suggest that although market activity has moderated, prices across the region remain resilient.
The year-to-date picture provides additional perspective. Through September, new listings declined just 0.7 percent to 8,373, pending sales decreased 1.0 percent to 5,859, and closed sales were down 1.1 percent to 5,647. The year-to-date median sales price increased 0.6 percent to $299,900, while the average sales price rose 1.5 percent to $311,560. These relatively modest changes suggest that the region’s overall housing market remains comparatively steady despite September’s slower activity.
The broader rolling 12-month view also reveals differences among price ranges and property types. From October 2025 through September 2026, pending sales declined 1.3 percent overall, but the $350,000-and-above price range recorded a 4.5 percent increase in contract activity. The Housing Supply Overview reports a rolling median sales price of $299,900, up 1.7 percent, with townhouse and condominium properties recording the strongest annual median price growth, increasing 20.2 percent to $210,950.
Regional Overview
September’s numbers reflect a market that continues to offer buyers more choices, alongside longer marketing timelines for sellers. Average days on market across all residential properties increased 12.1 percent to 65 days, compared with 58 days in September 2025. Sellers received an average of 98.0 percent of their most recent list price, compared with 98.3 percent a year earlier.
The rolling 12-month data reinforces this gradual adjustment. Average days on market increased 14.3 percent to 64 days. Homes priced at $350,000 and above took the longest to sell, averaging 76 days, while properties priced between $150,000 and $249,999 moved the fastest at 47 days.
For sellers, these trends reinforce the importance of accurate pricing, property preparation, and realistic expectations about how long a home may remain on the market. For buyers, more inventory creates opportunities to compare properties and explore options across communities and price ranges.
Although transaction pace has slowed, September’s price increases show that demand and pricing conditions vary across the market. Understanding those differences remains essential for making informed real estate decisions.
Existing Single-Family Homes
Existing single-family homes continued to account for the largest share of regional sales activity in September. New listings declined 3.4 percent to 589, while pending sales decreased 3.2 percent to 389. Closed sales fell 6.6 percent to 409.
Inventory increased 17.1 percent to 1,748 homes, while months of supply rose from 3.4 to 4.0. Despite the increase in available properties, the median sales price rose 5.8 percent to $280,500, and the average sales price increased 7.1 percent to $302,520.
Homes spent an average of 50 days on the market, up from 42 days a year earlier, a 19.0 percent increase. Sellers received an average of 97.6 percent of their most recent list price.
Importantly, year-to-date closed sales in this segment remained 1.3 percent above the same period in 2025, even as September’s monthly transactions declined. These results suggest existing-home sales have remained relatively stable throughout the year, with prices continuing to strengthen despite longer marketing periods.
New Construction
New single-family construction experienced fewer listings and completed transactions in September, although home prices continued to increase. New listings declined 20.8 percent to 126, pending sales decreased 4.5 percent to 127, and closed sales fell 12.2 percent to 115. Inventory rose 5.6 percent to 772 homes, bringing months of supply to 5.1, up from 4.6 months a year earlier. The median new-construction sales price increased 4.6 percent to $359,896, while the average sales price rose 4.3 percent to $380,992.
New-construction properties spent an average of 117 days on the market, compared with 113 days last September. Sellers received an average of 99.6 percent of their most recent list price.
While completed transactions declined, the modest drop in pending sales suggests buyers continue to pursue new-construction opportunities. The combination of additional inventory and rising prices highlights the importance of comparing available properties, builder offerings, and neighborhood-level conditions.
Townhouses and Condominiums
Townhouse and condominium activity slowed the most among the region’s major property segments in September. New listings declined 27.3 percent to 40, while pending sales decreased 26.5 percent to 25. Closed sales fell 40.6 percent to just 19 transactions. Inventory declined 10.1 percent to 161 properties, bringing months of supply to 5.6, compared with 5.9 months a year earlier.
The monthly median sales price decreased 14.9 percent to $163,000, while the average sales price declined 6.2 percent to $185,466. Properties spent an average of 90 days on the market, compared with 56 days last September, and sellers received an average of 96.7 percent of their most recent list price.
With only 19 completed transactions during the month, interpret these price changes cautiously. A relatively small number of sales can create substantial fluctuations in monthly averages and medians.
The longer-term picture tells a different story. The Housing Supply Overview reports that the rolling 12-month median sales price for townhouses and condominiums increased 20.2 percent to $210,950. Year-to-date median prices also increased 18.7 percent to $206,000.
These differences show why evaluating multiple time periods matters, especially when analyzing smaller segments of the housing market.
County-by-County Snapshot
Cumberland County
Cumberland County recorded 4,270 property showings in September, up 3.5 percent year over year, though activity fell 9.9 percent from August. The $150,000-to-$249,999 price range generated the most activity, with 1,698 showings, up 6.7 percent year over year. The $250,000-to-$349,999 range followed with 1,445 showings, up 19.4 percent.
Properties priced between $250,000 and $349,999 also drew the most buyer interest among the county’s major price ranges, averaging 3.6 showings per listing, up 20.0 percent from September 2025. At the higher end of the market, homes priced at $350,000 and above recorded 701 showings, a 20.3 percent year-over-year decline. Cumberland’s results demonstrate continued buyer activity in the middle price ranges, even as higher-priced properties experienced fewer showings and overall activity eased from August.
Hoke County
Hoke County recorded 742 property showings in September, down 14.4 percent year over year and 16.7 percent from August. The $250,000-to-$349,999 range generated the most activity, with 417 showings, though that was down 24.5 percent year over year. The $150,000-to-$249,999 range followed with 173 showings, up 12.3 percent. Properties priced between $150,000 and $249,999 drew the most buyer interest, with 4.6 showings per listing, suggesting continued engagement among buyers searching in that price range.
Meanwhile, homes priced at $350,000 and above generated 142 showings, up 9.2 percent year over year, despite fewer managed listings. Hoke’s results show a mixed market, with fewer overall showings but continued activity in both the lower-middle and higher price ranges.
Lee County
Lee County recorded 300 property showings in September, down 20.8 percent year over year and 14.3 percent from August. Homes priced at $350,000 and above generated the most activity, with 148 showings, followed by the $250,000-to-$349,999 range with 128 showings. The $250,000-to-$349,999 range drew the most buyer interest, averaging 3.4 showings per listing, while the $150,000-to-$249,999 range averaged 3.0 showings per listing.
Although the higher-priced segment continued to generate the most showings, activity in that range declined 19.1 percent year over year. Lee County’s results suggest that buyers have become more selective, with fewer showings occurring despite an increase in managed listings. These conditions reinforce the importance of competitive pricing and understanding neighborhood-specific buyer expectations.
Robeson County
Robeson County recorded 199 property showings in September, down 42.3 percent year over year and from August. The $150,000-to-$249,999 price range generated the most activity, with 73 showings, followed by the $250,000-to-$349,999 range with 53 showings. Both ranges experienced substantial year-over-year declines. However, properties priced at $350,000 and above recorded 47 showings, up 9.3 percent from September 2025. This segment also generated the county’s strongest buyer interest, averaging 2.3 showings per listing, a 53.3 percent year-over-year increase.
These results reveal a notable difference between overall market activity and performance within individual price ranges. While Robeson County saw fewer showings overall, higher-priced properties drew more engagement relative to the number of available managed listings.
Looking Ahead
September’s housing data presents a market that continues to adjust to changing conditions, with more homes available.
While closed sales declined 9.7 percent from a year earlier, the median sales price increased 3.6 percent, and inventory expanded 11.6 percent. The year-to-date figures remain comparatively stable, with closed sales down just 1.1 percent through September. The broader picture also shows that market conditions differ considerably by property type and price range.
The $350,000-and-above segment recorded the strongest rolling 12-month increase in pending sales, rising 4.5 percent. Meanwhile, inventory expanded fastest in the $150,000-to-$249,999 range, up 17.7 percent, followed by the $350,000-and-above range at 11.9 percent. These trends suggest buyers have more opportunities to compare homes and evaluate their options, while sellers must stay attentive to pricing, preparation, and competition.
For buyers, understanding inventory levels and neighborhood activity can help them spot opportunities. For sellers, local market expertise remains essential to determine an appropriate listing strategy and navigate longer marketing timelines. As the region moves into the final months of 2026, September’s data reinforces an important message: the housing market is not moving in a single direction, and local conditions matter.
Connect with a Longleaf Pine REALTORS® member to explore the market information most relevant to your next move.
Data reflects September 2026 reports, current as of October 10, 2026. Percentage comparisons are year over year unless otherwise noted. Regional housing statistics cover single-family homes, townhouses, and condominiums within the Longleaf Pine REALTORS® service area. County-level showing statistics reflect ShowingTime activity and should not be interpreted as completed sales or total market transactions. List-price-received figures use the most recent list price and do not account for seller concessions.
You can find all the reports that produced this article here: