

Local Market Snapshot: October 2026 in the Longleaf Pine REALTORS® Region
What the Latest Housing Data Shows Across Our Communities
October housing data across the Longleaf Pine REALTORS® region reflects a market where available inventory continues to expand, home prices remain resilient, and sales activity has slowed considerably compared with a year ago. While fewer homes went under contract or closed during the month, both median and average sales prices increased, highlighting the differences between transaction volume and property values.
For buyers, the growing number of available homes provides more opportunities to compare properties, explore neighborhoods, and make informed decisions. For sellers, the changing pace of activity reinforces the importance of competitive pricing, thoughtful preparation, and understanding local market conditions.
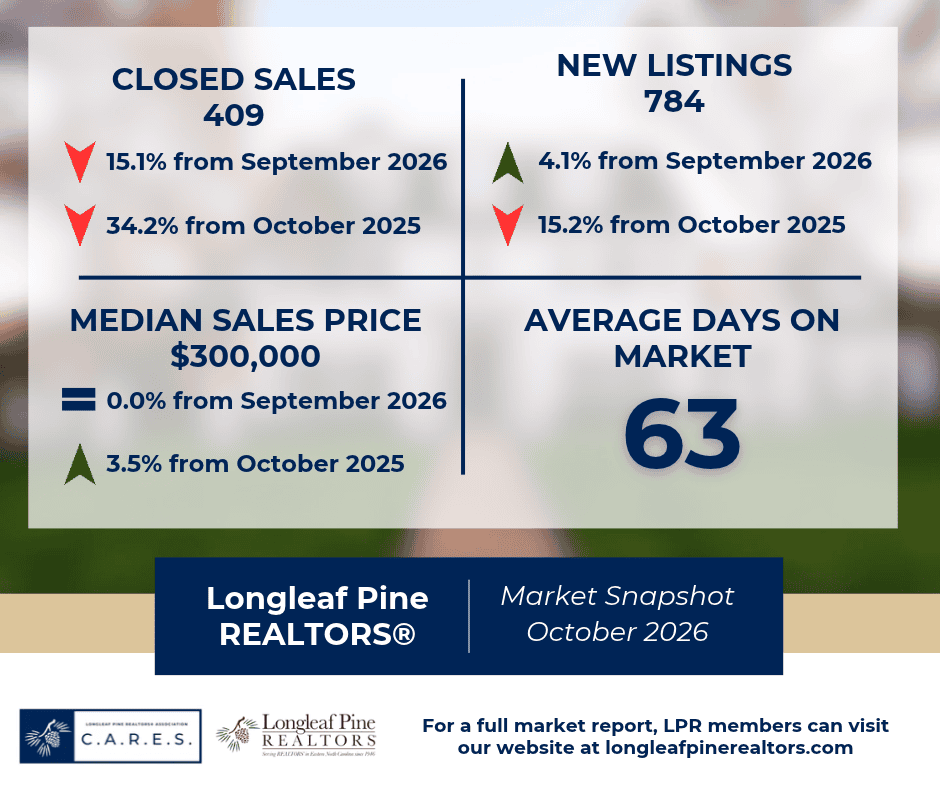
Across all residential properties, new listings declined 15.2 percent year over year to 784, while pending sales decreased 23.4 percent to 420. Closed sales fell 34.2 percent to 409, compared with 622 in October 2025.
Meanwhile, homes for sale increased 19.9 percent to 2,996, bringing the region to 5.1 months of inventory, compared with 4.0 months a year earlier. This increase represents a meaningful expansion in housing supply, offering buyers a wider selection even as fewer transactions are being completed.
Despite the slowdown in sales, home prices continued to show strength. The median sales price increased 3.5 percent to $300,000, while the average sales price climbed 7.4 percent to $319,734. These increases demonstrate that slower sales activity has not translated into broad-based price declines across the region.
The year-to-date picture provides additional perspective. Through October, new listings declined 2.3 percent to 9,144, pending sales decreased 4.0 percent to 6,206, and closed sales fell 6.3 percent to 5,930. However, the year-to-date median sales price increased 1.0 percent to $299,990, while the average sales price rose 2.1 percent to $312,334.
These figures suggest that while October experienced a sharper slowdown in transactions, the broader market has maintained relatively stable pricing throughout much of 2026.
The rolling 12-month data also reveals differences among price ranges and property types. From November 2025 through October 2026, pending sales declined 3.4 percent overall, but properties priced at $350,000 and above recorded a 1.8 percent increase in contract activity. The Housing Supply Overview reports a rolling median sales price of $299,900, up 1.7 percent, while townhouses and condominiums recorded a 20.0 percent increase in their rolling median sales price to $210,875.
Together, these trends illustrate a market that continues to adjust, with more inventory, longer-term price stability, and distinct differences in activity across property segments.
Regional Overview
October’s numbers reflect a housing market where buyers have more choices, but sales are taking place at a slower pace than a year earlier. Average days on market across all residential properties increased 3.3 percent to 63 days, compared with 61 days in October 2025. Sellers received an average of 98.1 percent of their most recent list price, unchanged from a year earlier. Although homes are taking slightly longer to sell, the steady percentage of list price received suggests that properly positioned properties can continue to attract buyers.
The rolling 12-month data reinforces the importance of understanding individual price ranges. Homes priced between $150,000 and $249,999 moved the fastest, averaging 48 days on market, while properties priced at $350,000 and above took the longest, averaging 76 days.
Inventory increased across every major price range. Homes priced at $350,000 and above experienced the largest percentage increase in available properties, rising 21.5 percent year over year. Properties priced between $150,000 and $249,999 followed closely, with inventory increasing 20.4 percent.
The region’s overall housing supply reached 5.1 months, representing a 27.5 percent increase from October 2025. This shift gives buyers additional opportunities to explore properties while creating a more competitive environment for sellers.
For sellers, these conditions emphasize the importance of setting realistic expectations, preparing homes for the market, and responding to buyer feedback. For buyers, increased inventory can create greater flexibility when evaluating location, price, property condition, and available features.
While October’s decline in closed sales is notable, the continued increase in median and average sales prices shows that market conditions cannot be measured by transaction volume alone.
Existing Single-Family Homes
Existing single-family homes continued to represent the largest share of regional sales activity in October, although this segment experienced a substantial slowdown compared with the same month last year.
New listings declined 18.8 percent to 537, while pending sales decreased 23.9 percent to 296. Closed sales fell 34.7 percent to 295, compared with 452 in October 2025. Despite fewer new listings and completed transactions, inventory continued to expand. The number of existing single-family homes available for sale reached 1,937, bringing months of supply to 4.7, compared with 3.6 months a year earlier.
Home prices remained resilient. The median sales price increased 4.8 percent to $277,500, while the average sales price climbed 11.1 percent to $312,775. Existing homes spent an average of 52 days on the market, compared with 50 days in October 2025. Sellers received an average of 97.5 percent of their most recent list price, unchanged from a year earlier.
The year-to-date picture shows a more moderate adjustment. Through October, closed sales in this segment declined 4.4 percent, while the year-to-date median sales price increased slightly to $275,000. These results suggest that existing-home prices have remained relatively stable despite fewer completed transactions. With more properties available, sellers may face greater competition, particularly when comparable homes offer similar features or pricing.
For buyers, the expanded selection of existing homes provides opportunities to evaluate established neighborhoods, property conditions, and long-term housing needs.
New Construction
New single-family construction experienced a decline in completed transactions during October, while available inventory continued to grow. New listings decreased 1.5 percent to 202, while pending sales fell 18.5 percent to 101. Closed sales declined 30.5 percent to 98, compared with 141 in October 2025. Inventory increased 16.1 percent to 878 homes, bringing months of supply to 6.0, up from 4.8 months a year earlier.
Unlike the existing-home segment, new-construction prices declined slightly during the month. The median sales price decreased 1.8 percent to $339,750, while the average sales price fell 1.7 percent to $361,708. However, the longer-term figures provide additional context. Through October, the year-to-date median new-construction sales price increased 0.6 percent to $349,950, while the average sales price rose 1.6 percent to $368,971.
New-construction properties spent an average of 93 days on the market, compared with 97 days a year earlier. Sellers received an average of 99.8 percent of their most recent list price. Although fewer newly constructed homes closed during October, the segment’s shorter average marketing time compared with last year suggests that properties reaching the market are not necessarily taking longer to secure buyers.
The combination of increased inventory and slightly lower monthly prices creates opportunities for buyers to compare new-construction communities, floor plans, locations, and builder offerings.
For sellers and builders, the growing supply reinforces the importance of understanding competing developments and aligning pricing with current buyer expectations.
Townhouses and Condominiums
Townhouse and condominium activity remained limited in October, with fewer listings, pending contracts, and completed transactions compared with a year earlier. New listings declined 23.7 percent to 45, while pending sales decreased 34.3 percent to 23. Closed sales fell 44.8 percent to just 16 transactions, compared with 29 in October 2025. Inventory increased 5.2 percent to 181 properties, bringing months of supply to 6.7, compared with 5.7 months a year earlier.
The monthly median sales price declined 19.8 percent to $180,500, while the average sales price decreased 8.3 percent to $190,955. Properties spent an average of 94 days on the market, compared with 70 days in October 2025, representing a 34.3 percent increase. Sellers received an average of 97.6 percent of their most recent list price. With only 16 completed transactions during the month, these price changes should be interpreted cautiously. A small number of sales can significantly influence monthly averages and medians, particularly when the mix of properties sold changes.
The longer-term picture offers a different perspective. Through October, the year-to-date median sales price increased 17.3 percent to $207,000, while the average sales price rose 6.5 percent to $206,977.
The Housing Supply Overview also reports a 20.0 percent increase in the rolling 12-month median sales price for townhouses and condominiums, reaching $210,875.
These differences demonstrate why examining multiple time periods is especially important when evaluating smaller property segments. Although October experienced fewer transactions and lower monthly prices, the broader annual figures indicate that pricing trends have varied considerably throughout the year.
County-by-County Snapshot
Cumberland County
Cumberland County recorded 3,625 property showings in October, down 18.2 percent year over year and 14.4 percent from September. The $150,000-to-$249,999 price range generated the most activity, with 1,359 showings, although that represented a 25.1 percent decline from October 2025. Properties priced between $250,000 and $349,999 followed with 1,155 showings, down 11.5 percent year over year. Despite the overall decline, homes priced at $149,999 or less experienced a slight increase in activity, recording 482 showings, up 1.0 percent from a year earlier and 15.6 percent from September.
Properties in this lowest price range also generated the strongest buyer interest, averaging 3.2 showings per listing, compared with 2.9 in the $250,000-to-$349,999 range. At the higher end of the market, homes priced at $350,000 and above recorded 629 showings, down 24.4 percent year over year.
Overall, Cumberland County’s results reflect slower buyer activity across most price ranges, with continued interest in more affordable properties. The increase in showings for homes priced below $150,000 suggests that affordability remains an important consideration for some buyers. For sellers, these trends reinforce the importance of understanding how their property compares with competing listings in the same price range.
Hoke County
Hoke County recorded 652 property showings in October, down 23.1 percent year over year and 10.7 percent from September. The $250,000-to-$349,999 price range continued to generate the most activity, with 331 showings. However, that represented a substantial 40.7 percent decline compared with October 2025. Meanwhile, properties priced between $150,000 and $249,999 recorded 165 showings, an increase of 43.5 percent year over year. Homes priced at $149,999 or less also experienced an increase, with 34 showings, up 54.5 percent. These lower-priced segments generated the county’s strongest buyer interest, averaging 4.0 showings per listing in the $150,000-to-$249,999 range and 4.7 showings per listing for homes priced at $149,999 or less. At the higher end, properties priced at $350,000 and above recorded 122 showings, down 20.3 percent year over year.
Hoke County’s results reveal an important difference between overall market activity and buyer engagement within specific price ranges. While total showings declined, properties below $250,000 experienced increased activity compared with a year earlier.
This suggests that buyers remain engaged in more affordable segments of the county’s housing market, even as activity has slowed for higher-priced properties.
Lee County
Lee County recorded 303 property showings in October, an increase of 10.6 percent year over year and 2.6 percent from September. Unlike Cumberland and Hoke counties, Lee County experienced an overall increase in showing activity, with growth concentrated in the middle and higher price ranges. Homes priced at $350,000 and above generated the most activity, with 147 showings, up 15.7 percent year over year. Properties priced between $250,000 and $349,999 followed closely with 133 showings, an increase of 27.9 percent. The $250,000-to-$349,999 range also generated the strongest buyer interest among the county’s major active price segments, averaging 3.1 showings per listing. Meanwhile, properties priced between $150,000 and $249,999 recorded just 17 showings, a 60.5 percent decline year over year.
Lee County’s results stand apart from the broader regional trend, demonstrating continued buyer engagement in the $250,000-and-above market.
The increase in showings for middle- and higher-priced homes suggests that buyer activity remains concentrated in these segments, even as demand for lower-priced properties has softened. These differences highlight why county-level market information is essential when evaluating housing conditions across the region.
Robeson County
Robeson County recorded 227 property showings in October, down 29.1 percent year over year but up 15.0 percent from September. The $150,000-to-$249,999 price range generated the most activity, with 119 showings, representing a 19.0 percent increase compared with October 2025 and a 60.8 percent increase from September. Properties priced between $250,000 and $349,999 followed with 51 showings, down 30.1 percent year over year. At the lower end of the market, homes priced at $149,999 or less recorded 40 showings, a 64.0 percent year-over-year decline. Properties priced at $350,000 and above generated 17 showings, down 52.8 percent. The $150,000-to-$249,999 range also recorded the strongest buyer interest, averaging 1.9 showings per listing, compared with the countywide average of 1.5.
Although Robeson County experienced fewer showings overall, the increase in activity for homes priced between $150,000 and $249,999 provides a more encouraging signal within that segment.
The month-over-month increase in total showings also suggests that buyer activity improved from September, even though it remained below the level recorded a year earlier. These results reinforce the importance of examining both monthly and annual comparisons when evaluating local housing trends.
Looking Ahead
October’s housing data presents a region experiencing a meaningful shift in market activity, with more homes available, fewer completed transactions, and continued price resilience. Closed sales declined 34.2 percent from a year earlier, while pending sales fell 23.4 percent. At the same time, the median sales price increased 3.5 percent to $300,000, and available inventory expanded 19.9 percent to 2,996 homes. The year-to-date figures show a more moderate slowdown, with closed sales declining 6.3 percent through October and the median sales price increasing 1.0 percent. The broader rolling 12-month picture also reveals important differences across price ranges. Properties priced at $350,000 and above recorded a 1.8 percent increase in pending sales, even as overall pending sales declined 3.4 percent.
Inventory expanded across every major price range, with the largest percentage increase occurring among properties priced at $350,000 and above. The additional supply gives buyers more opportunities to compare properties while creating greater competition among sellers.
County-level showing activity further illustrates that the housing market is not moving in a single direction. Cumberland and Hoke counties experienced notable declines in overall showings, while Lee County recorded increased activity. Robeson County experienced fewer showings than a year earlier but improved from September.
For buyers, the growing selection of homes offers opportunities to evaluate neighborhoods, compare property features, and make decisions that align with their financial goals. For sellers, the changing market reinforces the value of accurate pricing, property preparation, and understanding how competing listings may influence buyer expectations.
As the Longleaf Pine REALTORS® region approaches the end of 2026, October’s data highlights an important message: more inventory and slower sales do not tell the entire story of the housing market. Conditions continue to vary by county, property type, and price range, making local knowledge and professional guidance especially valuable.
Whether buying, selling, or simply exploring future possibilities, working with a REALTOR® can help you with the data most relevant to your home buying or selling experience.
Connect with a Longleaf Pine REALTORS® member to explore the market information most relevant to your next move.
Data reflects October 2026 reports, current as of November 10, 2026. Percentage comparisons are year over year unless otherwise noted. Regional housing statistics cover single-family homes, townhouses, and condominiums within the Longleaf Pine REALTORS® service area. County-level showing statistics reflect ShowingTime activity and should not be interpreted as completed sales or total market transactions. List-price-received figures use the most recent list price and do not account for seller concessions. Rolling 12-month statistics cover November 2025 through October 2026. Figures are subject to revision.
You can find all the reports that produced this article here: