

Local Market Snapshot: August 2026 in the Longleaf Pine REALTORS® Region
What the Latest Housing Data Shows Across Our Communities
August housing data across the Longleaf Pine REALTORS® region reflects a market with more available inventory, fewer completed sales, and modest overall price growth. Pending sales also edged lower, while homes spent more time on the market than a year ago. Together, these measures show a slower pace of activity, but not a uniform decline in prices or demand.
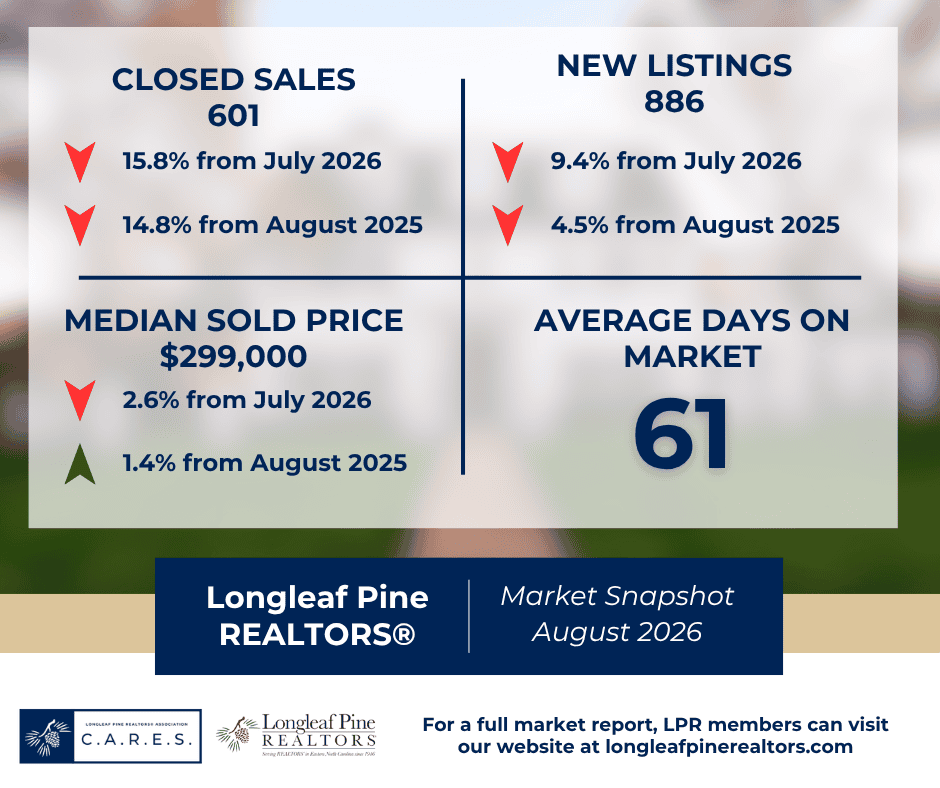
Across all residential properties, new listings declined 4.5 percent year over year to 886. Pending sales decreased 2.4 percent to 622, while closed sales fell 14.8 percent to 601. Homes for sale increased 13.8 percent to 2,697, bringing the region to 4.4 months of inventory, compared with 3.8 months a year earlier. The median sales price increased 1.4 percent to $299,000, while the average sales price rose 2.4 percent to $318,125.
The year-to-date picture remains comparatively steady. Through August, new listings were essentially unchanged at 7,610, pending sales increased 0.3 percent to 5,365, and closed sales declined 0.5 percent to 5,080. The year-to-date median sales price increased slightly—up 0.1 percent to $299,900—while the average sales price rose 1.0 percent to $311,305.
The broader rolling 12-month view shows stronger contract activity at higher price points. From September 2025 through August 2026, pending sales declined 0.5 percent overall, but the $350,000-and-above range rose 6.6 percent. New-construction pending sales across all property types rose 0.8 percent. The Housing Supply Overview reports a rolling median sales price of $299,000, up 1.4 percent, with townhouse and condominium properties posting the strongest price growth—up 21.2 percent to $209,950.
Regional Overview
August’s numbers point to a market with more available choices and longer marketing timelines than a year ago. Average days on market across all residential properties increased 10.9 percent to 61 days, compared with 55 days last August. Sellers received an average of 98.7 percent of their most recent list price, unchanged from a year earlier.
The rolling 12-month data reinforces this slower pace. Average days on market increased 16.4 percent to 64 days. Properties priced at $350,000 and above took the longest to secure an accepted offer, averaging 75 days. The $150,000-to-$249,999 range moved the fastest at 46 days, although that was still 31.4 percent longer than a year earlier.
For sellers, this combination underscores the importance of accurate pricing, thoughtful preparation, and realistic expectations about timing. For buyers, increased inventory creates more opportunities to compare properties, while differences among price ranges make neighborhood-level information especially valuable.
Existing Single-Family Homes
Existing single-family homes remained the largest source of regional sales activity. New listings increased 0.9 percent to 653, while pending sales declined 3.8 percent to 450. Closed sales decreased 12.5 percent to 439.
Inventory increased 18.5 percent to 1,733 homes, while months of supply rose from 3.4 to 4.0. The median sales price was nearly unchanged, declining 0.2 percent to $277,450, while the average sales price increased 1.6 percent to $304,312.
Days on market increased from 40 to 49 days, a 22.5 percent increase. Existing homes received an average of 98.5 percent of their most recent list price. Despite August’s decline in closings, year-to-date closed sales in this segment remained 1.8 percent above the same period last year.
New Construction
New single-family construction recorded fewer new listings and completed sales in August, while contract activity held steady. New listings declined 23.9 percent to 175, pending sales were unchanged at 143, and closed sales decreased 18.9 percent to 133.
Inventory increased 8.5 percent to 801 homes, producing 5.2 months of supply, compared with 4.7 months a year earlier. The median new-construction sales price increased 1.7 percent to $355,900, while the average sales price rose 1.4 percent to $373,729.
New-construction homes received an average of 99.9 percent of their most recent list price and spent 95 days on the market, compared with 94 days last August. This segment’s results show steady pending activity and modest price gains alongside a decline in completed transactions.
Townhouses and Condominiums
Townhouse and condominium activity produced mixed results in August. New listings increased 13.7 percent to 58, and pending sales rose 11.5 percent to 29. Closed sales, however, declined 25.6 percent to 29.
Inventory decreased 3.6 percent to 163 properties, while months of supply edged down from 5.6 to 5.5. The monthly median sales price increased 9.5 percent to $241,000, and the average sales price rose 26.4 percent to $271,744. Days on market increased from 70 to 86 days, while sellers received an average of 97.7 percent of their most recent list price.
With only 29 closings during the month, consider these price changes alongside the segment’s limited transaction volume rather than interpreting them as uniform increases in individual property values. For a longer-term perspective, the Housing Supply Overview reports a rolling 12-month median price of $209,950, up 21.2 percent.
County-by-County Snapshot
Cumberland County
Cumberland County recorded 4,738 showings in August, up 3.1 percent year over year but down 6.5 percent from July. Buyer interest measured 3.5 showings per listing, an increase of 6.1 percent from a year ago, while managed listings declined 2.8 percent to 1,483.
The $150,000-to-$249,999 range generated the most activity with 1,994 showings, followed by the $250,000-to-$349,999 range with 1,579. Both ranges averaged 3.8 showings per listing, the strongest buyer-interest measure among the county’s reported price bands. Homes priced at $350,000 and above generated 778 showings, down 13.8 percent year over year. Cumberland’s results show stronger year-over-year showing activity below $350,000, even as overall activity eased from July.
Hoke County
Hoke County recorded 891 showings in August, up 19.0 percent year over year but down 18.2 percent from July. Buyer interest increased 33.6 percent from a year ago to 3.3 showings per listing, while managed listings declined 11.0 percent to 309.
The $250,000-to-$349,999 range led the county with 498 showings, followed by the $150,000-to-$249,999 range with 195. Homes priced at $350,000 and above recorded 170 showings. Lower-priced properties generated the strongest engagement per listing: the $150,000-to-$249,999 range averaged 5.1 showings per listing, while the limited number of properties below $150,000 averaged 6.5. Although activity slowed from July, Hoke recorded year-over-year showing gains in every reported price range.
Lee County
Lee County recorded 350 showings in August, down 4.1 percent year over year and 3.3 percent from July. Buyer interest measured 2.8 showings per listing, a decline of 29.4 percent from last year, while managed listings increased 35.8 percent to 144.
The $350,000-and-above range generated the most activity with 169 showings, up 5.6 percent year over year. The $250,000-to-$349,999 range followed with 124 showings. Properties priced from $150,000 to $249,999 recorded the strongest buyer interest at 4.9 showings per listing, although the report included only nine managed listings in that range. Lee’s results show more managed listings alongside fewer overall showings and lower engagement per listing.
Robeson County
Robeson County recorded 345 showings in August, down 16.9 percent year over year and 15.4 percent from July. Buyer interest nevertheless increased 6.8 percent from a year ago to 2.1 showings per listing, while managed listings declined 22.1 percent to 197.
The $150,000-to-$249,999 range generated the most activity with 156 showings, followed by the $250,000-to-$349,999 range with 87. Homes priced at $350,000 and above recorded 57 showings, an increase of 39.0 percent from a year ago, and generated the county’s strongest buyer interest at 2.6 showings per listing. Robeson’s results show a slower overall pace, with a pocket of year-over-year growth at the higher end of the market.
Looking Ahead
August’s housing data presents a mixed picture: fewer completed sales and slightly lower pending activity, alongside more available inventory and modest overall price growth. The year-to-date totals remain close to last year’s levels, providing important context for the sharper decline in August closings.
The market is not moving uniformly across price points. The $350,000-and-above range posted the strongest rolling 12-month gain in pending sales, while inventory expanded most rapidly in the $150,000-to-$249,999 range, up 22.8 percent. Inventory at $350,000 and above also increased substantially, rising 20.8 percent. These differences reinforce the value of looking beyond a single regional headline.
For buyers and sellers alike, the practical takeaway is to build decisions around local conditions. Buyers should compare available properties within their target neighborhoods and price ranges, while sellers should approach pricing, preparation, and marketing with realistic expectations about competition and timing.
For community-specific guidance, connect with a Longleaf Pine REALTORS® member to explore the market information most relevant to your next move.
Data reflects the August 2026 reports, current as of September 10, 2026. Percentage comparisons are year over year unless otherwise noted. List-price-received figures use the most recent list price and do not account for seller concessions.
You can find all the reports that produced this article here: